This is the fourth blog post in this series dealing with seawater chemistry and global maritime trade. In this classroom activity students predict the buoyancy (and hence stability) of a merchant cargo ship based on interpretation of seawater surface salinity values. Conclusions drawn from Observations 1-4 (described in the first two posts) plus the third post, which focuses on salinity, serve as the foundation for this fourth activity. Like the first three posts the question types in this post are conceptual (= non-mathematical). And as described previously, this activity uses Just in Time Teaching (JiTT) and Think-Pair-Share (TPS) teaching and student engagement (individually and in groups) approaches. Click on the following links to access each of the first three posts in this series- Intro (Part 1), Part 2, and Part 3.
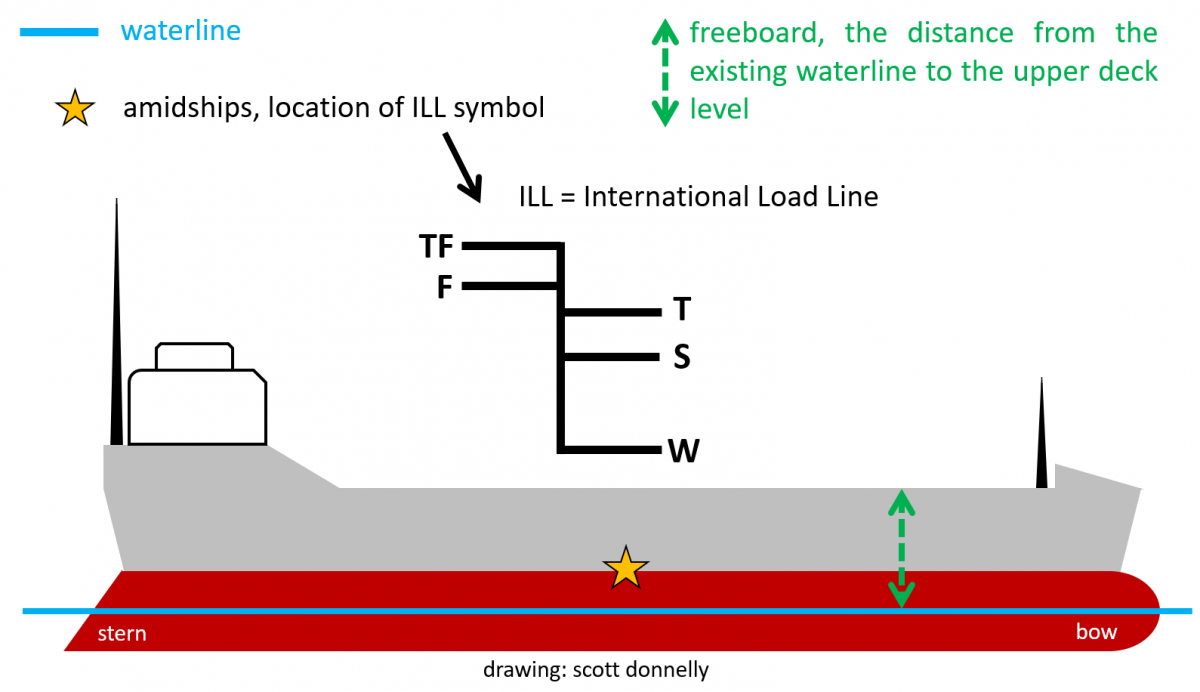
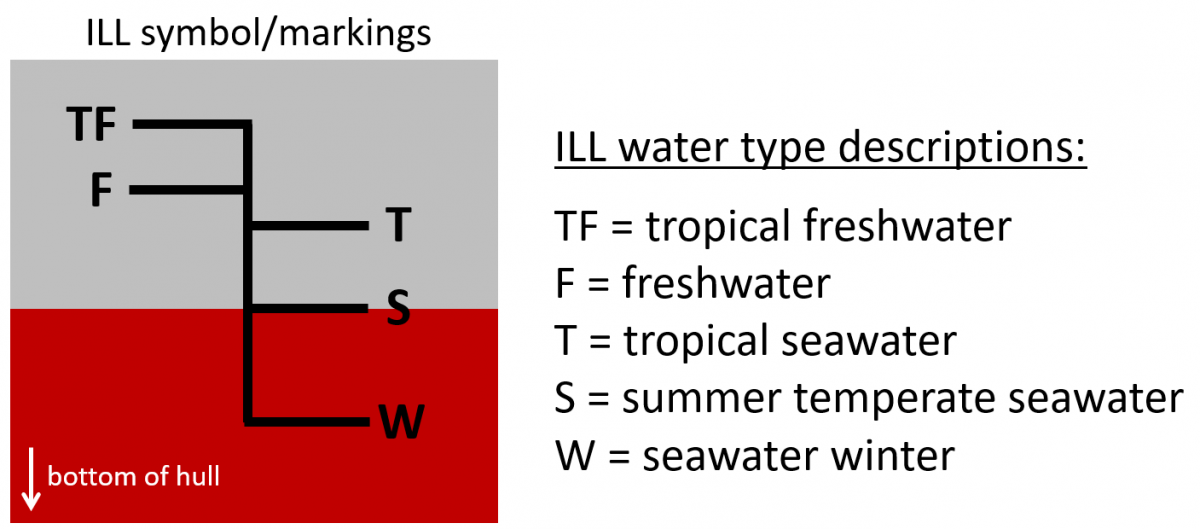
So as to not get lost in terminology encountered in previous posts of this series, below is a visual representation of the definitions of certain maritime related words. Parts 1 and 2 of this series discussed ILL in detail.
Starter questions (Q1-3): The starter questions below are designed to give the instructor the chance to address any deficiencies in students' understanding about the connections between and among salinity (or dissolved salt concentration)- discussed in Part 3-, buoyancy, solute concentration, solution density, and volume displacement.
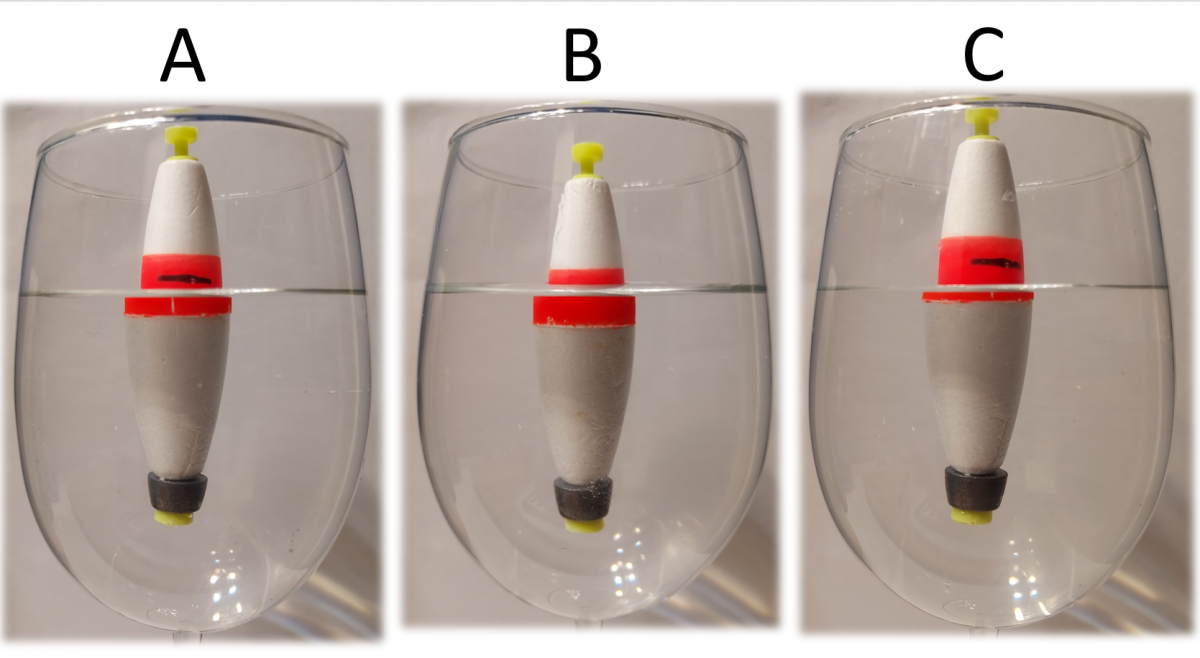
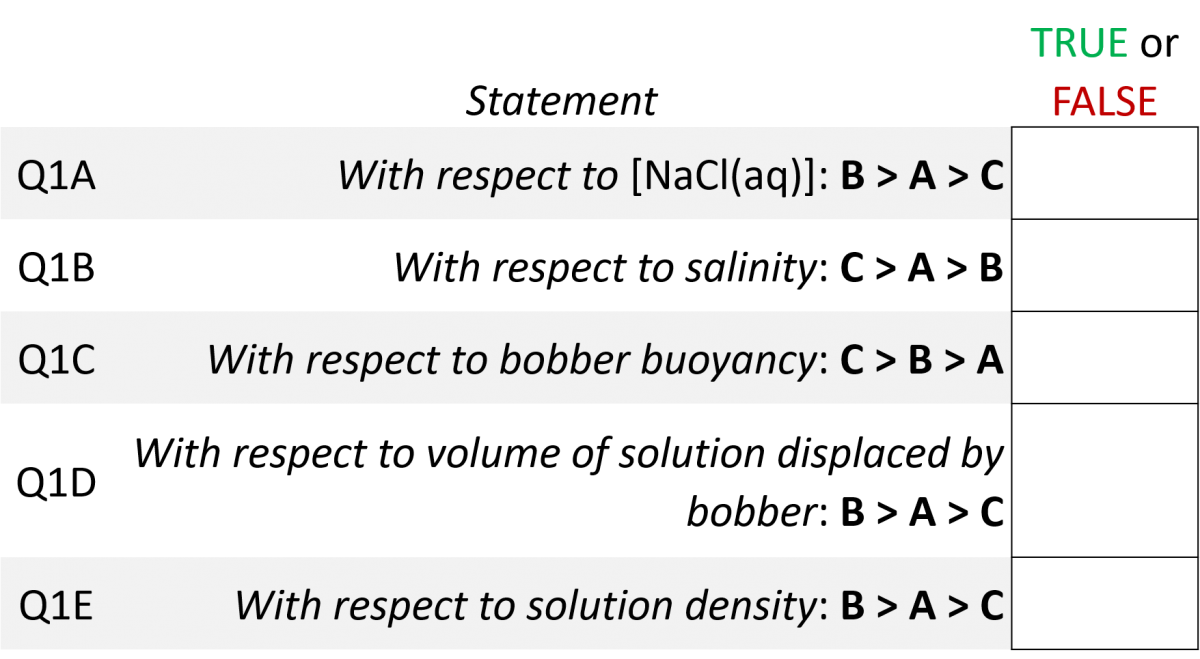
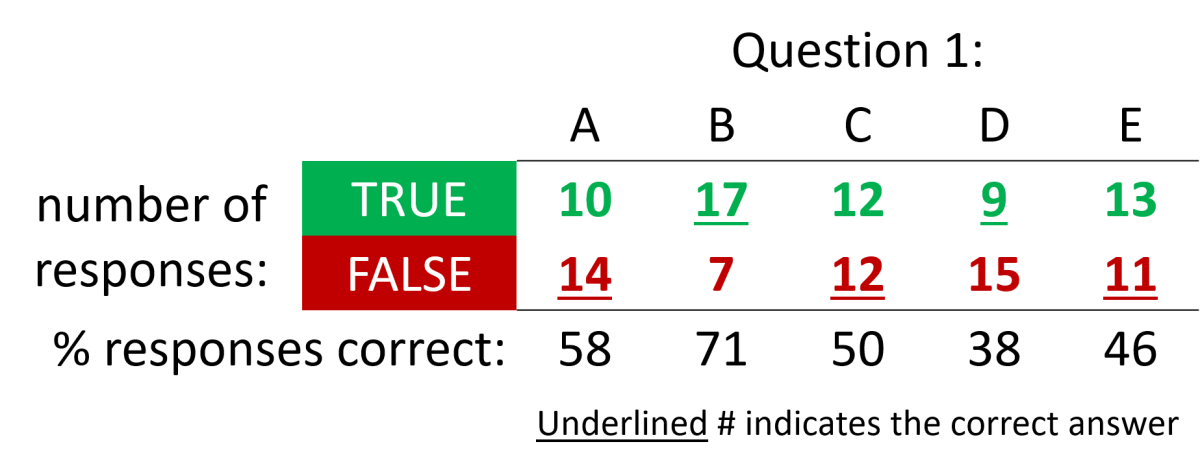
Q1: Each of the three photos below shows an aqueous solution of sodium chloride. The horizontal black line on the fishing bobber in photos A and C indicates the waterline position when the bobber floats in solution B. Tsolution: A = B = C. Photo source: scott donnelly
Determine if each italicized statement below is TRUE or FALSE. If FALSE, rewrite the statement so that it is TRUE. Once done, compare your answer for each question A-E with another student(s). Perhaps, upon discussion, you will change an answer(s), or perhaps not.
Q2: Suppose for solution A the following happens, ΔTsolution A = (-) [and solution A remains in liquid phase]. For the stated change in temperature, determine for each variable below if the variable change is (+), (-), or 0. Once done, compare your answers for each variable with another student(s). Perhaps, upon discussion, you will change your prediction, or perhaps not.
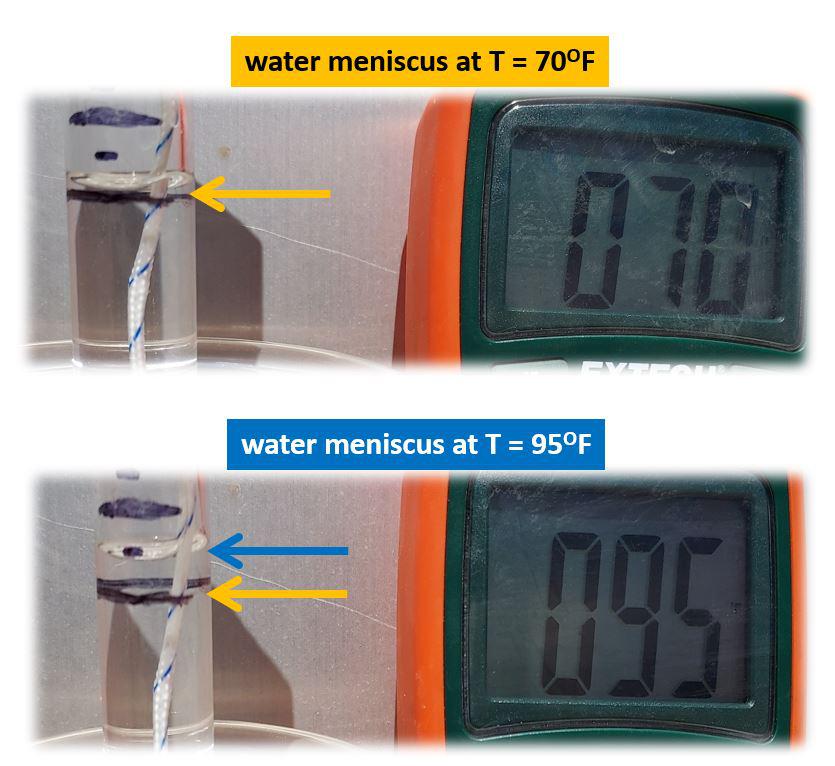
Q2 answers (column, left to right): +, +, +; ΔTsolution A = (-) means Tf < Ti. Aqueous solution A cools. "Solution A remains in the liquid phase" means the solution did not cool enough to freeze so Tf > approx. -1oC. Upon cooling the mass of water and NaCl dissolved remain the same. With ΔTsolution A = (-), it follows then ΔVsolution A = (-) leading to Δdsolution A = (+). As indicated in the photos the greater the mass of dissolved NaCl in the same volume of water at the same temperature translates into the fishing bobber floating higher above the liquid surface (= a greater freeboard and buoyancy for the fishing bobber). The photo below (source: the author; Observation 2 from the first blog post in this series) shows the relationship between the temperature and volume of liquid water (in the temperature range shown).
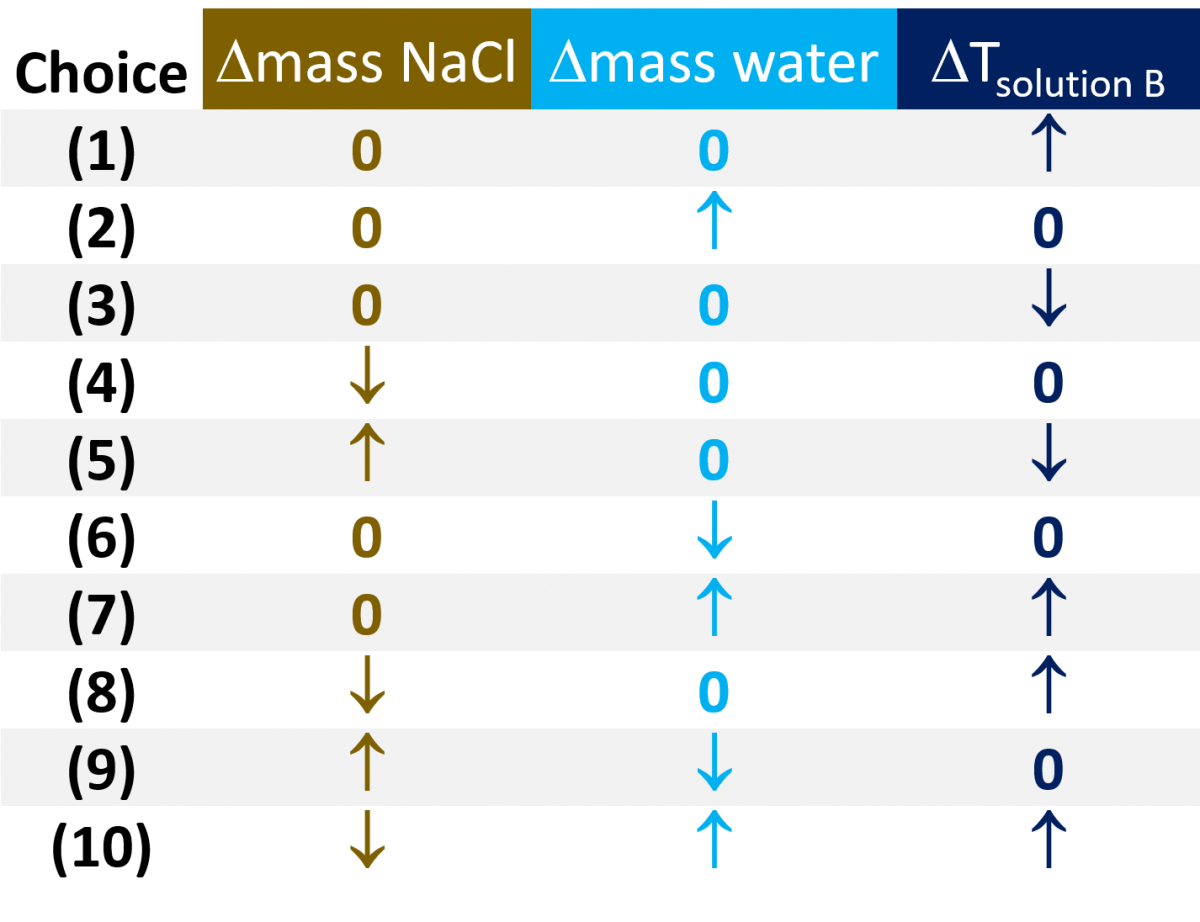
Q3: The objective in this question is to change the conditions of B so that B behaves more like C. Which choice(s) below then, if any, is (are) predicted to result in B behaving more like C? Once done, compare your choice(s) with another student(s). Perhaps, upon discussion, you will change a choice(s), or perhaps not.
Q3 answers: Choices (3), (5), (6), (9); up arrow = increase (or positive change), down arrow = decrease (or negative change)
Commentary about Starter Questions 1-3: I designed these questions to be used in tandem (the order perhaps is not so important) or for each as a stand-alone. Also, as discussed in previous posts in this series each question generates its own set of new data and provides new teaching/learning options about data organization and analysis. Three options are described below:
1. An in-class or take-home assignment option is to have students identify the new data points generated from their individual responses, aggregate the class data (n = ?), organize it visually (pie chart, bar graph, x-y scatter plot, box-and-whiskers plot, and so on) and then look for patterns. An example is below.
2. Once the new data set is organized and patterns found, then have students write a Results summary as is found in journal papers.
3. Another option described previously in this series is to insert a Confidence Level statement into the question. Did students basically guess (a not so good scenario), or did they expend some intellectual energy to actually figure out the question? If a robust majority basically guessed, then the instructor has a 'muddiest point' teaching situation.
Application of salinity data: Earth's oceans are vast and different in many respects, including water chemistry as related to composition, concentration, density, salinity, pH, dissolved oxygen (DO), and more. Today's massive merchant ships carry hundreds of millions of dollars in cargo. It is the ship's masters' responsibility to deliver that valuable cargo from port A to port B safely and without incident at either port and during sail. To ensure the safe delivery of cargo, a ship's master needs a working knowledge of the seasonal salinity zones that the ship under the master's command sails through. And to avoid a disastrous loss in inventory (and no doubt one's career) either at sea or in port, it follows that a ship's master needs to have a working understanding of the relationship between a ship's buoyancy, its stability, and water type the ship is sailing through.
A quick review- as learned in the conclusions drawn from observations 1-4 in the first two blog posts, a ship's buoyancy (as measured by its freeboard) is related to the water type it sails through as a ship floats higher or lower in water depending on the water type (as defined by the ILL on the ship's hull).
A ship's master judges the initial stability of a loaded or non-loaded ship based on the ILL markings of home port. But once away from home port the ship's master must also know the water type that the ship will sail through and the water type at the destination port because the ship will float higher or lower in different water types. Let's apply this knowledge to the scenario described below (Q4 with three versions; for each version the question wording is mostly the same but the type of answer choices is different; same question but different ways for students to answer).
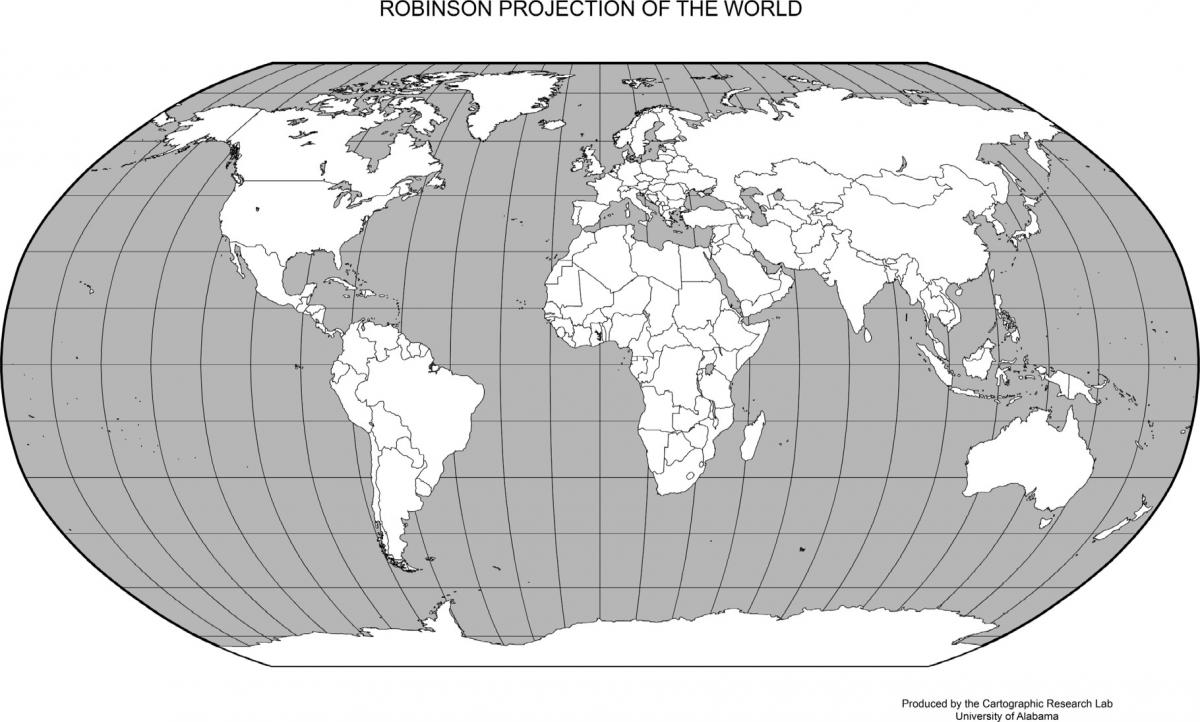
Note to instructor for Q4: JiTT. Q4 involves the application of latitude and longitude coordinates to find a location (in this instance, a coastal port) on a map. Some students may have a working knowledge of lat/long coordinates from a previous class. Others maybe not. So an instructor may want to canvas the class and ask students about their confidence in applying/working with lat/long coordinates to find location. If need be, team students with working knowledge of lat/long with those that do not or are not as comfortable with lat/long. This is a good opportunity to show how learning about something in a different class (say, earth science or geography or history) is relevant and applicable to another class (chemistry).
Check out the Supporting Information document for both black and white and colored Robinson world map projections (in the SI document larger than below) with lat/long lines intact but absent the degrees (let students figure out the degrees). Source below: Cartographic Research Lab University of Alabama
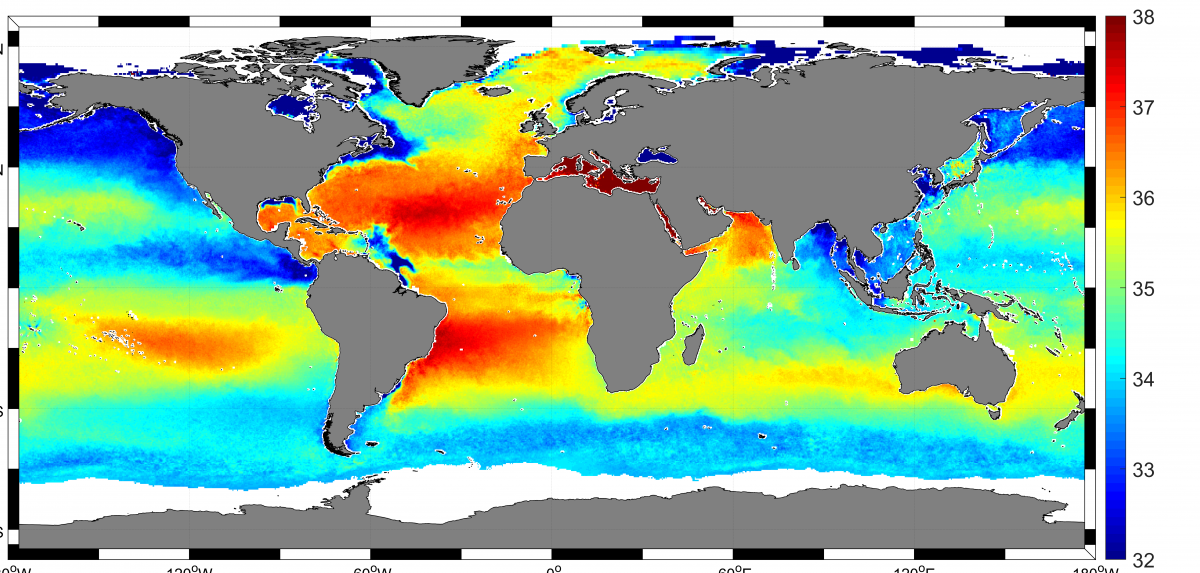
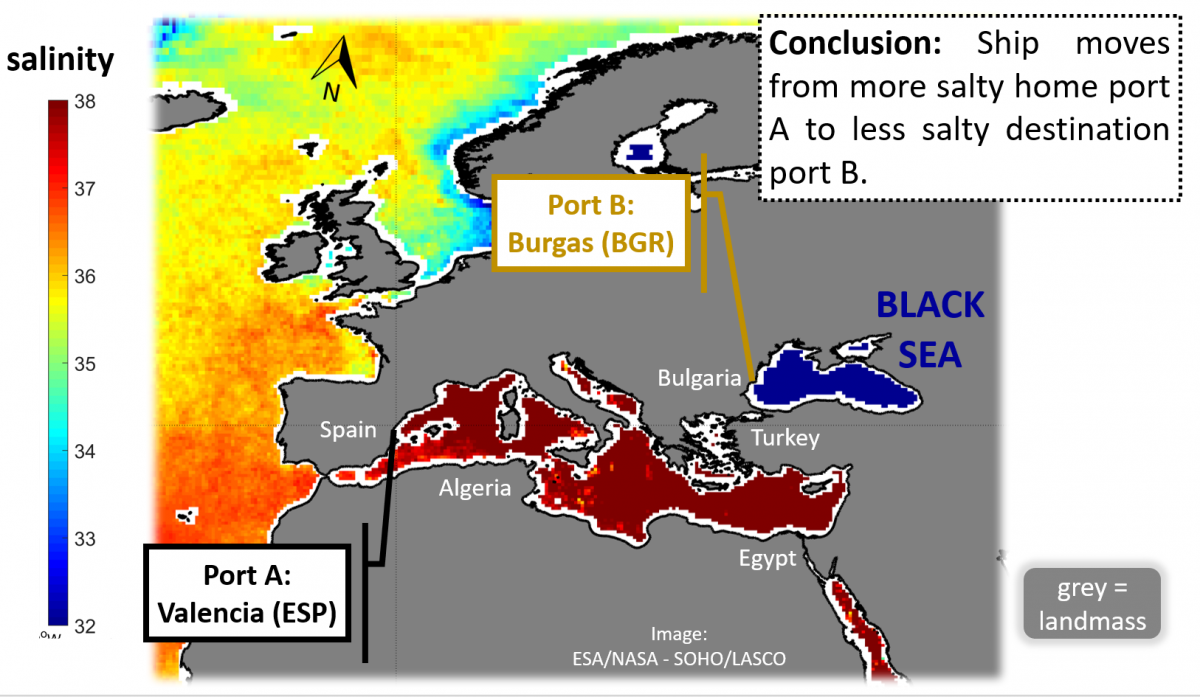
Q4 uses the sea surface salinity map below and as utilized in other questions in this series Think-Pair-Share engagement strategy to encourage intra- and inter-group student discourse. Image source below: https://www.esa.int/ESA_Multimedia/Images/2019/05/Global_sea-surface_salinity; ESA/NASA - SOHO/LASCO; colored vertical axis on right = salinity (ppm)
(Image: a large image of the above is found in this post's Supporting Information document)
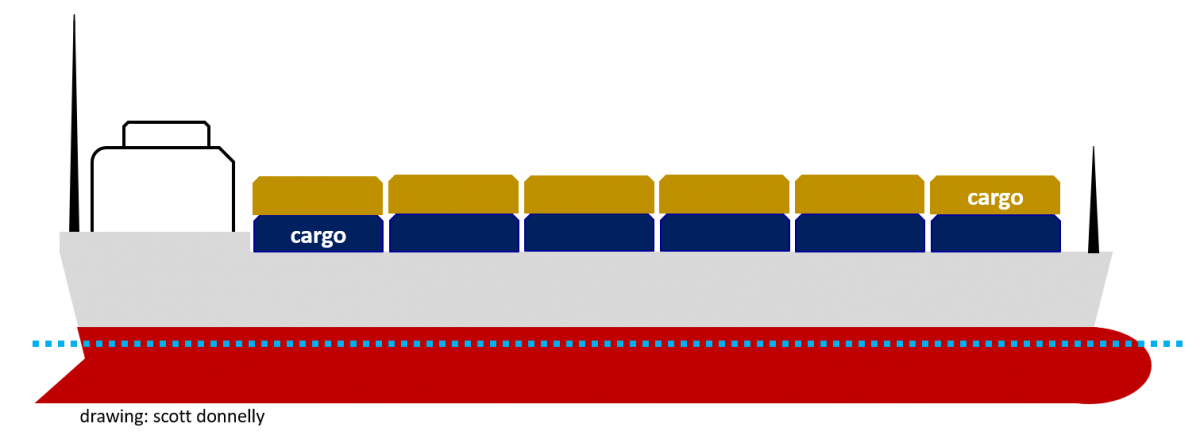
Q4 (version 1): A loaded merchant cargo ship sets sail from home port A (39.4°N, 0.32°W). Its destination is port B (42.5°N, 27.5°E). It does not stop to load/unload between ports A and B. The colored drawing of the merchant ship below shows the waterline when the ship departs from port A. Twater is the same at both ports. Assume, for simplicity, that the loss of mass from the consumption of fuel during the trip is insignificant compared to the entire combined mass of the ship plus cargo before unloading at the destination port.
On the drawing below draw the approximate predicted waterline when the ship docks at port B. Once done, compare the location of your waterline drawing with another student(s). Perhaps, upon discussion, you will change the location, or perhaps not.
Instructor note: A black and white drawing of the merchant cargo ship above is found in this post's Supporting Information document; you may use the drawing without fee and permission from the author (me) for educational purposes only. Out of professional courtesy please keep the recognition, drawing: scott donnelly, intact when photocopying and I humbly ask that you not modify the drawing. Thank you and enjoy!
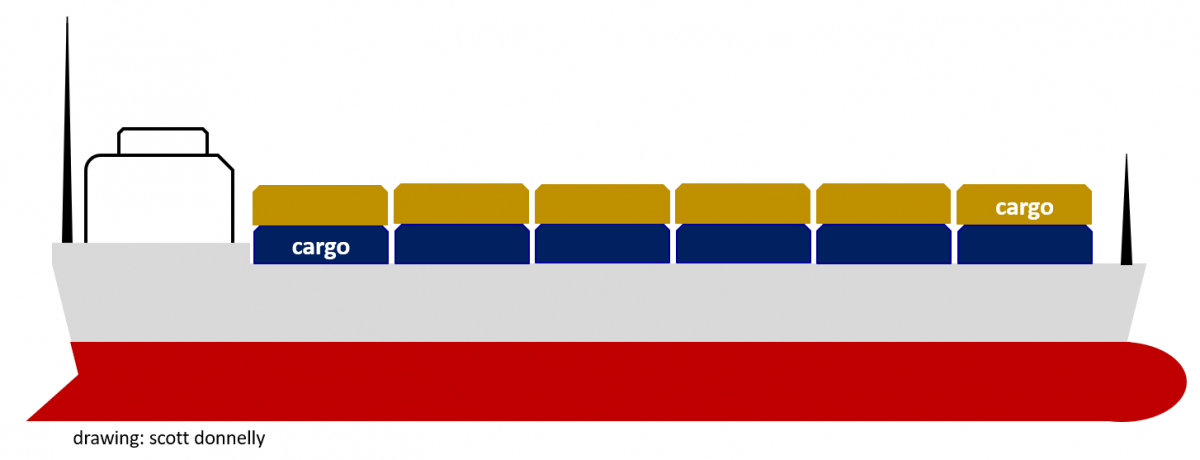
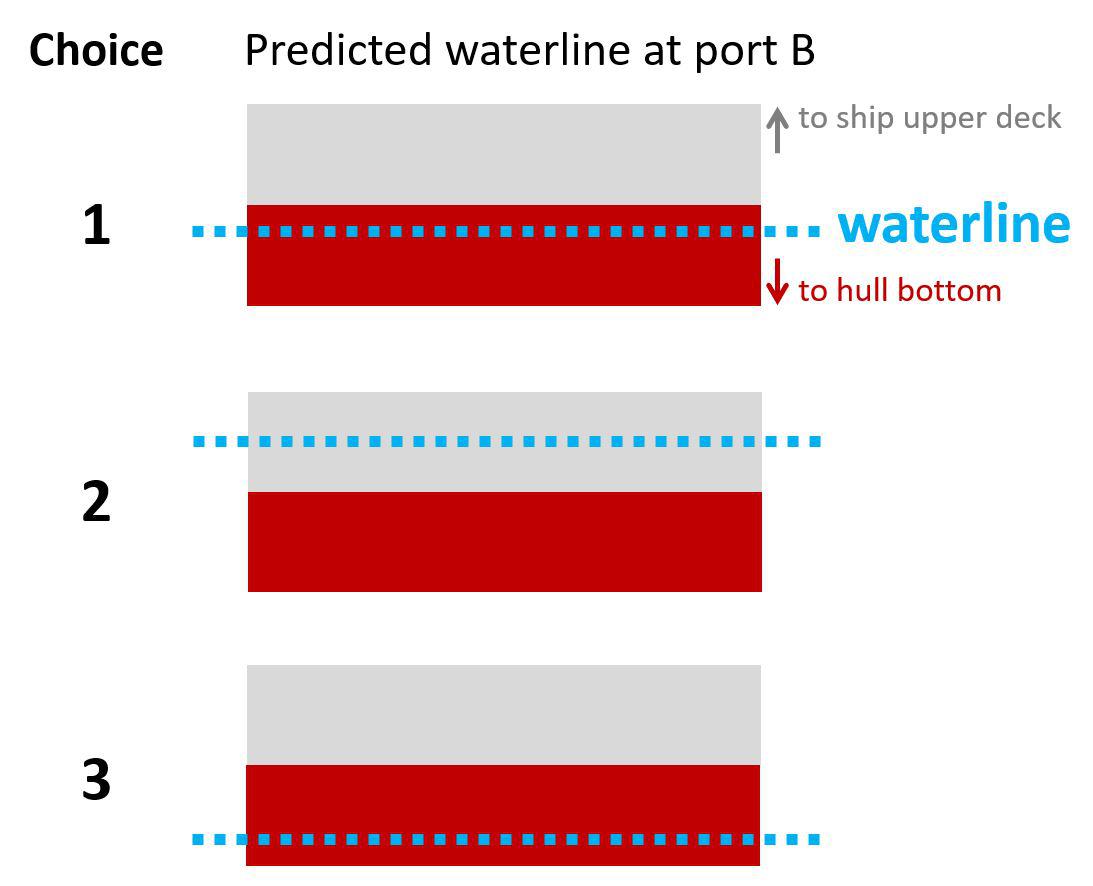
Q4 (version 2): A loaded merchant cargo ship sets sail from home port A (39.4°N, 0.32°W). Its destination is port B (42.5°N, 27.5°E). It does not stop to load/unload between ports A and B. Twater is the same at both ports. The colored drawing of the merchant ship below shows the waterline when the ship departs from port A. Assume, for simplicity, that the loss of mass from the consumption of fuel during the trip is insignificant compared to the entire combined mass of the ship plus cargo before unloading at the destination port.
Which choice below, if any, is the predicted location of the waterline at port B? Choice 4 = none of the choices. Once done, compare your choice with another student(s). Perhaps, upon discussion, you will change your mind, or perhaps not.
Q4 (version 3): A loaded merchant cargo ship sets sail from home port A (39.4°N, 0.32°W). Its destination is port B (42.5°N, 27.5°E). It does not stop to load/unload between ports A and B. Twater is the same at both ports. Assume, for simplicity, that the loss of mass from the consumption of fuel during the trip is insignificant compared to the entire combined mass of the ship plus cargo before unloading at the destination port.
Complete the table below for the changes in the four variables in sailing from port A to B. ↔ = no change Once done, compare your predictions for each variable with another student(s). Perhaps, upon discussion, you will change your mind, or perhaps not.
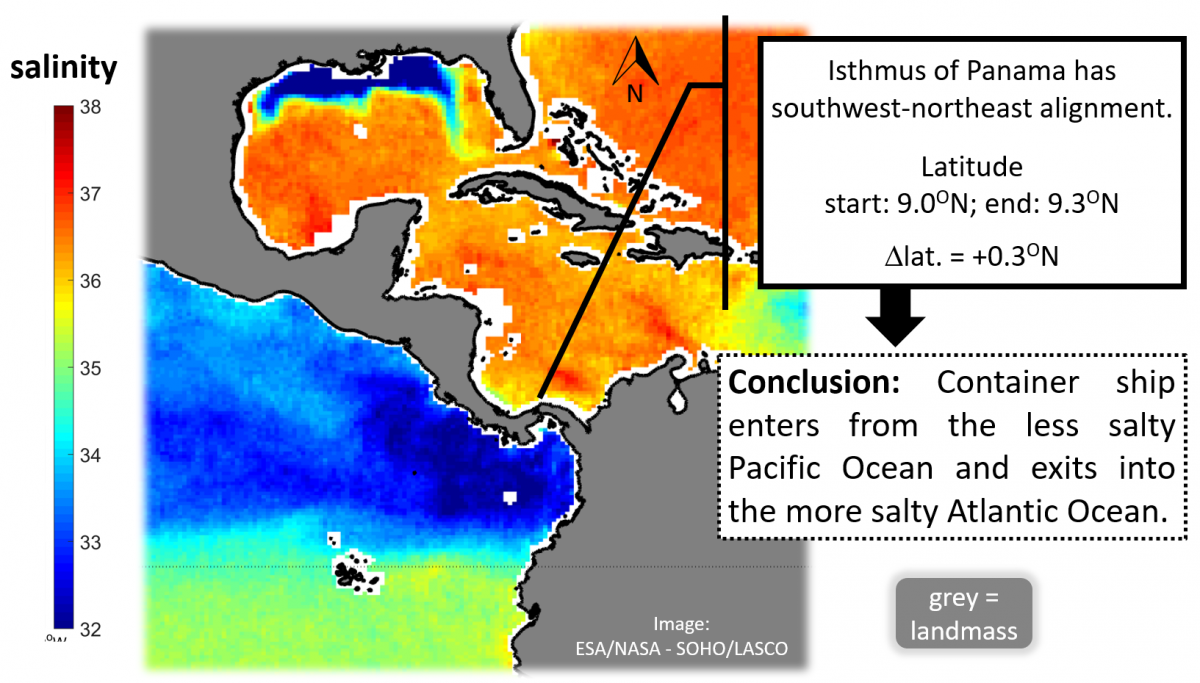
Of course, any two ports or non-port locations can be used. For example, what about the Panama Canal? How does a working knowledge of water salinity come into play at this international shipping geographical choke point?
Q4 (version 4): The Panama Canal, which cuts across the Isthmus of Panama, was completed in 1914 and continues to be a major maritime trade conduit between the Atlantic and Pacific Oceans. Ship passage through the Panama Canal saves valuable time and fuel as otherwise ships must sail around the treacherous, stormy seas of Cape Horn at the southern tip of the continent of South America. Suppose a container merchant ship transits through the canal, entering the canal locks system at 09.0°N, 79.2°W and exiting at 09.3°N, 79.5°W.
a. The drawing below shows the waterline when the ship exits the Panama Canal.
Answer types:
a. On the drawing* below draw the approximate predicted waterline when the ship enters the Panama Canal. Once done, compare the location of your waterline drawing with another student(s). Perhaps, upon discussion, you will change the waterline location, or perhaps not. *: use merchant ship drawing without waterline as is in Q4 version 1
b. Which choice* below, if any, is the predicted location of the waterline when the ship enters the Panama Canal? Choice 4 = none of the choices. Once done, compare your choice with another student(s). Perhaps, upon discussion, you will change your mind, or perhaps not. *: use answer type table Q4 version 2; in the table header change "at port B" to "when ship enters Panama Canal"
c. Complete the table* below for the changes in the four variables when the merchant cargo ship transits the Panama Canal from one ocean to the other as defined by the changes in the lat/long coordinates. ↔ = no change. Once done, compare your predictions for each variable with another student(s). Perhaps, upon discussion, you will change your mind, or perhaps not. *: use answer type table as is in Q4 version 3
In closing, I'll leave it to you to figure out the answers for Q4 version 4a-c. So far the questions have been conceptual types, that is non-mathematical. The next post will introduce some mathematical type questions related to seawater chemistry and its predictive influence on a ship's buoyancy at sea. I'll also discuss seasonal salinity zones as Earth's oceans and seas are dynamic systems of movement and change. If indeed chemistry is the central science as we chemists like to say it is, then it follows that chemistry should have some role in explaining how it all works.
Thanks for reading...sjd

