Trends related to placement of elements on the periodic table are often taught using diagrams in a textbook. Students often memorize trends, but to get a true grasp of their meaning and what causes certain patterns is best understood when students create their own models and discuss the patterns with others.
This inquiry activity was designed to be carried out in ninety minutes, with few supplies, yet produces an accurate visualization of the trends. The tiered levels of questions and reflection may be used to differentiate between introductory, advanced first-year, and AP chemistry. Students create their own diagrams using blank periodic tables of the main group elements in the first four periods. Four models are developed: atomic radius, ionic radius, ionization energy, and electronegativity.
The activity detailed here is different from other readily available inquiry-based activities as it seeks to support student learning and concept development by using an actual Periodic Table as a template. By mapping specific trends directly onto a blank Periodic Table, the activity
- Uses the Periodic Table as a foundational aspect of the major trends, allowing for students to make connections between placement on the Periodic Table and a specific trend
- Supports development of a causal understanding of why trends change as they do through the creation of a graphical representation
- Reduces the cognitive load for all students by linking trends directly to the periodic table, a tool available to students throughout the chemistry course. The Teacher Guide accompanying this activity further supports teachers in determining the most appropriate level at which to address student learning needs through a list of suggested questions and discussion starters.
- Allows for students to develop a product (Periodic Table colored-coded per trend) so that students readily understand where, why, and how in terms of the development of the picture/Periodic Table created.
Additionally, the Teacher Guide accompanying this activity supplies questions and dialogue intended to support those new to teaching periodic trends and/or new to using guided inquiry-based activities.

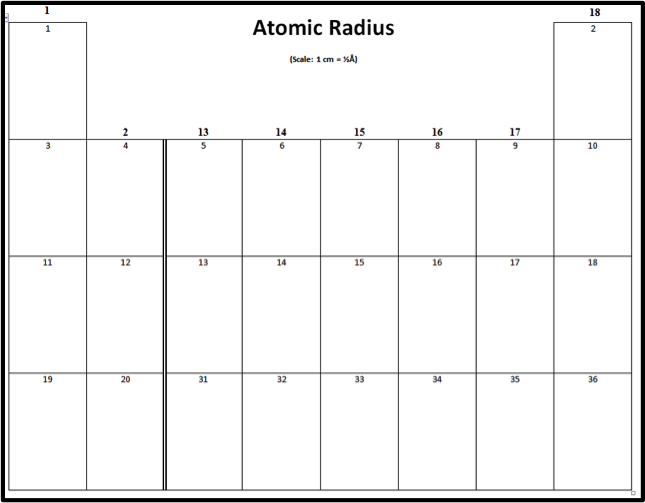
Figure 1: Blank periodic table for students to use in the Introductory Investigation. There is a separate table for each of the four trends, with the headings changed as appropriate.
This activity is designed for high school or college general chemistry classes. It is presented following introductory lessons about the history of the periodic table and the significance of periods and groups in terms of valence electrons and energy levels, but before any trends have been discussed. The students begin the activity individually during class by developing predictions, then creating four models, one for each periodic trend. The students then work collaboratively in groups of three or four to analyze trends in each model and develop conclusions. The groups extend and reinforce their conclusions through a series of thought-provoking questions. Finally, the groups share their results with the class and the class reflects on their learning.
The supporting information includes black-line masters of all of the materials used by the students, and a teacher’s guide that include suggested guided questions and answers, differentiated by level.

Figure 2: Sample of data table provided to students
The Activity
This section is completed individually. The activity begins with four blank periodic tables (Figure 1) that include boxes for the main-group elements in the first four periods, plus data tables (Figure 2) with the values for each trend. The values in the data tables are the most common found in high school textbooks.1, 2 For the first model, atomic radius, the students use a metric ruler to draw a dot measuring up from the bottom of the box a distance marking the diameter of each element. Next they hand-draw a circle using the dot and bottom of the box as a guide for the height of the circle. (Figure 3) It is important to point out that the measurements are not the actual size of atoms, so a scale is included.

Figure 3: Sample of completed atomic radius table. Color is optional.
For the second model, students will use the metric ruler to draw vertical “energy bar” lines proportional to ionization energies (Figure 4).
Figure 4: Sample of ionization energy bars. Advanced or AP discussion includes the irregularities in group 13 and group 16. Discussion starters and explanations are included in the Teacher’s Guide.
For the third model, the students will again use the metric ruler to create circles with a diameter proportional to the diameter of each ion, similar to what was done in Part 1 (Figure 5).

Figure 5: Sample of Ionic Radius. Lively discussion ensues as students try to explain the unusual trends across periods.
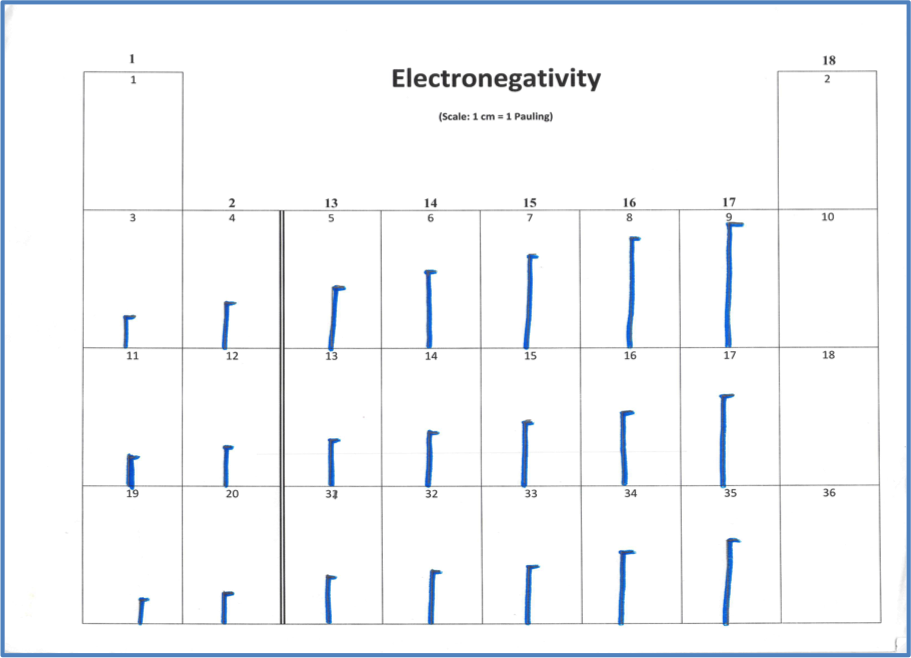
In the fourth model, students will again use vertical lines proportional to electronegativity values (Figure 6).

Figure 6: Sample of Electronegativity table. Note that the electronegativities of the noble gases are zero, effectively.
Group Discussion and Class Reflection
After the independent construction of the four models, students are divided into groups of three or four. Each group is prompted to describe the trends that they observe for each of the four models.
Each group discusses the follow-up questions, while each student records individual answers on their follow-up sheet. Questions are differentiated depending on the level of students. For example, first-year students will understand that atomic radius increases from top to bottom down a group and decreases from left to right across a group, where advanced or AP students can combine two trends to conclude that atomic radius increases diagonally from top right to bottom left. This makes the activity applicable for varying levels.
The activity is concluded as students present their observed trends to the entire class. The teacher can facilitate discussion using the appropriate-level reflection questions. Several methods for facilitating reflection, as well as sample questions and suggested answers are included in the Teacher’s Guide for this activity.
First-year students have shared some excellent observations. One group noticed that the size of ions going across is unusual, but it does follow a pattern. The size of ions going across a row went from smallest to largest based on ionic charges. For example, element number 7 has an ionic charge of -4, and is the largest in period 2. Element number 6 has an ionic charge of +4, and it is the smallest. Considering the ionic charges, the pattern in size is, from largest to smallest across the period of main group elements, -4, -3, -2, -1,+1, +2, +3, +4. The class then went on to notice that the size had to do with how many electrons are lost or gained.
If this topic is taught after electron configuration, advanced/AP students can easily visualize the anomalies in ionization energy in Groups 3 and 5, and understand that the electron configuration explains this phenomenon.
This activity has been piloted by multiple teachers in classes of varying levels. The teachers have reported that the activity is inexpensive, easy and time-efficient for the students to complete, and led to good discussion and comprehension based on answers to guided questions and follow-up assessments.
Log in to obtain access to two levels of the student document and a teacher document in the Supporting Information.
Cited Articles
1- Brown, T. L.; Lemay, H.E. Chemistry: The Central Science 12 ed.; Prentice Hall: New York, 2012, p 261.
2 - Buthelezi, T; Dingrando, L; Hainen, N; Wistrom, C; Zike, D. Chemistry: Matter and Change 8th edition Glencoe/McGraw Hill: Columbus, OH, 2007, p 194.
The activity is designed for two, 50-minutes class periods or one 90 minute period. The individual sections can be completed in one 50-minute class period. The concept formation, group sharing and reflection can be completed in another 50-minute class period.
For each student:
1 Ruler
4 Blank periodic tables (one for each of the following: atomic radius, ionic radius, ionization energy, and electronegativity) of the main group elements in the first four periods. (in Supporting Information)
The activity begins with four blank periodic tables that include boxes for the main-group elements in the first four periods, plus data tables with the values for each trend. This section is completed individually. The values in the data tables are the most common found in high school textbooks.
In Part 1, atomic radius, the students use a metric ruler to draw a dot measuring up from the bottom of the box a distance marking the diameter of each element. Next they hand-draw a circle using the dot and bottom of the box as a guide for the height of the circle. It is important to point out that the measurements are not the actual size of atoms, so a scale is included.
In Part 2, students will use the metric ruler to draw vertical “energy bar” lines proportional to ionization energies.
In Part 3, the students will again use the metric ruler to create circles with a diameter proportional to the diameter of each ion, similar to what was done in Part 1.
In the fourth model, students will again use vertical lines proportional to electronegativity values.
See the student and teacher documents for the questions and discussion portion of the activity.
See the Student and Teacher documents.
Make copies of student worksheet, data tables and blank main-group tables.
Dr. Patrick Harvey, Dr. Amanda Edwards, Dr. Lori Maffe helped pilot the activity. Tobie Hendricks, Dr. Michelle Head and Dr. Gregory Rushton supported me in writing the activity.
NGSS
Students who demonstrate understanding can use the periodic table as a model to predict the relative properties of elements based on the patterns of electrons in the outermost energy level of atoms.
*More information about all DCI for HS-PS1 can be found at https://www.nextgenscience.org/dci-arrangement/hs-ps1-matter-and-its-interactions and further resources at https://www.nextgenscience.org.
Students who demonstrate understanding can use the periodic table as a model to predict the relative properties of elements based on the patterns of electrons in the outermost energy level of atoms.
Assessment is limited to main group elements. Assessment does not include quantitative understanding of ionization energy beyond relative trends.
Examples of properties that could be predicted from patterns could include reactivity of metals, types of bonds formed, numbers of bonds formed, and reactions with oxygen.


All comments must abide by the ChemEd X Comment Policy, are subject to review, and may be edited. Please allow one business day for your comment to be posted, if it is accepted.
Comments 4
gratitude
Thank you!
Thanks a million!!
I had no idea how to make this more hands on for my students. Thank you.
Question
I have a quick question. While my students are familiar with the periodic table..they will not know what is ionization energy..or ionic radius. Do I explain all this terms before i start the guided inquiry...or should i let them stumble and learn and figure out...Thank you for your help...
Shanthi
Still using these in my classroom!
I've been using these in my classroom since going to your presentation on them at ChemEd 2015. They are great!