Use Your Smartphone as an "Absorption Spectrophotometer"
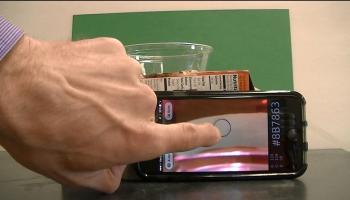
A smartphone can be used in a remarkably simple and inexpensive way to teach your students about absorption spectroscopy and Beer’s Law. In short, light reflected off of colored construction paper is passed through a sample and detected by an RGB application on a smartphone. The materials and setup are so simple that students can easily construct several “spectrophotometers” that can be used in a variety of experiments in your classroom. When using the system students learn some basic ideas about the processes involved in a working absorption spectrometer. Excellent results can be achieved; my students routinely obtain absorbance vs. concentration data sets with linear fits of R2 = 0.98 or better.
The video below describes how to set up an iPhone for use as a “spectrophotometer”. Below the video you can find further helpful tips (not covered in the video) on how to set up your own “smartphone spectrophotometer”. For example, the further tips describe how to use an Android instead of an iPhone in the experiment.
Let me know if you use this experiment in your classes. I’d love to hear about any experiments you conduct in your classroom using this set up.
Further tips:
1. This blog post and the video above describe some aspects of the following publication in the Journal of Chemical Education: Teaching Beer’s Law and Absorption Spectrophotometry with a Smart Phone: A Substantially Simplified Protocol. Several other details, as well as a student worksheet, can be found by accessing the publication link.
2. Any application that can detect average R, G, and B values in real time will work. As stated in the video, the application “Colorometer” works well on the iPhone. Further information regarding this app can be found at the following link: https://itunes.apple.com/us/app/colorometer/id509865412?mt=8.
Two applications that work well on an Android are:
a. “Colorimeter”, (comes with a nominal cost). See: https://play.google.com/store/apps/details?id=com.colorimeter
b. “Colormeter Free”. See: https://play.google.com/store/apps/details?id=com.vistechprojects.colormeterfree&hl=en
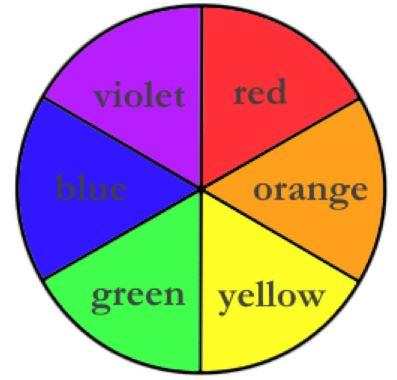
3. Because the light detector is an RGB analyzer, it is pedagogically most straightforward to limit the color of background construction paper to be red, green or blue. A color wheel (see below) can be used to help determine the background color of construction paper to be used. To do so, choose the color on the color wheel that is opposite the color of the solution to be analyzed. This “opposite color” is called the “complimentary color”. Since red is the compliment of green, if a green colored solution is to be analyzed, then red construction paper should be used as the background. It may be that the appropriate complimentary color is not red, green or blue. In this case, simply choose a color that closely matches the complementary color. For example, even though orange is the compliment of blue, we have successfully used a red background to analyze blue samples, because red closely matches orange.
4. As an alternative to colored construction paper, light from a computer screen can be used as a light source. To do so, access the following link on the computer:
http://academo.org/demos/wavelength-to-colour-relationship/ .
a. For blue light, set the wavelength to 440 nm.
b. For green light, set the wavelength to 510 nm.
c. For red light, set the wavelength to 680 nm.
5. It is useful to use drinks that can be bought at the grocery store for stock solutions from which the standard solutions can be made. As seen in the video, we have used Fruit Punch PowerAde Zero as a stock solution of 95±5 x 10⁻⁶ M Red Dye #40. We have also used Blueberry Pommegranate Gatorade as a stock solution of 12±1 x 10⁻⁶ M Blue Dye #1. Using these solutions as “stock”, we often find the concentration of Blue Dye #1 in Mountain Berry Blast PowerAde to be 4.3±0.5 x 10⁻⁶ M and Red Dye #40 in Strawberry PowerAde Zero to be 4.5±0.5 x 10⁻⁶ M.
Editor’s Note (10/22/20):
- The apps suggested here may not keep up with the changes as smartphones are updated. Please share in the comments if you have found apps that work well with android and/or IOS. As of this note, Color Name is one recommended RGB app.
- Tom Kuntzleman published a related activity, Chemical Kinetics with a Smartphone, in November 2019.

Tom Kuntzleman
I have taught science at all levels from Kindergarten through upper division undergraduate. Member of ACS, AACT.
Comments
32Can't wait to try it!
Hi Tom,
Thanks for sharing this. I've been wanting to try this idea for quite some time, and will finally give it a go in May when I have a few extra hours of time once my IB seniors are done. I'll give you an update at that time.
In reply to Can't wait to try it! by LowellThomson
Thanks, Lowell!
I look forward to hearing about how it goes. Please be sure to send along any suggestions for improvement. Also let me know anything new you learn!
Tom
Hi Tom,
I just got the app on my phone, and I am going to have my senior students not taking the AP exam figure this out once we finish our last unit. I'll let you know how it goes.
In reply to Hi Tom, by Dunmore High School
Great to hear from you, John
John:
Good to hear from you! I hope all is well. Let me know how it works out for your students. Let me know if you guys run into any snags or if you have any questions.
Tom
In reply to Great to hear from you, John by Tom Kuntzleman
Tom,
All is well. Tell your family I said hello.
Question: Did you use pure, powdered dyes to determine the concentrations of the fruit punch and blueberry stock solutions used as the standards? Or another method?
In reply to Tom, by Dunmore High School
Great question
I did not use pure powdered dyes. I used the known molar absorptivity of Red Dye #40 and Blue Dye #1 found in the reference listed here. I then used our Hitachi U-2900 absorption spectrometer to measure the absorbance of the Fruit Punch PowerAde Zero and Blueberry Pommegranate Gatorade. The concentrations of Red Dye #40 in the PowerAde and Blue Dye #1 found in the Gatorade were then found using A = ebc (A is absorbance, e is molar absorptitivity, b is pathlength of cuvette, c is concentration). The results for the concentrations I found using this method were similar - to within the error I cited in the blog - to what was found at the reference found here. If you do some experimenting and find that my cited concentrations are off, please do let me know so that I can list better values.
Great experiment !!
It a great experiment. Students will love it.
Thanks
Pascual Lahuerta
Valencia-Spain
In reply to Great experiment !! by Pascual Lahuerta
Thank you!
Thank you so much for commenting, Pascual! Let me know what your students think.
Cheers,
Tom
Experiment
Tom - I plan to use this next fall for my online chemistry students in some way, shape, or form. I can't wait to try this myself very soon. Have you tried manipulating the ambient light in the room at all? That is, a darkened room with a single lamp on the colored paper? Thanks for sharing all of your work and any plans to show this at the BCCE this summer?
In reply to Experiment by John Muench
Great idea!
Hi John:
Thank you so much for commenting!
When I was first working out this experiment, I attempted to block ambient light from the sample much as one would do with a real spectrophotometer. When doing this, I was using light from a computer screen as the light source. To use a computer screen as a light source, you can use the following link. I found it worked best if I just allowed the ambient light to fall on the sample and sample box as indicated in the video. I next tried using colored construction paper and found it to work without blocking out ambient light. So no, I haven't tried the set up you describe. I would LOVE for you to try this and report back! Let me know if you get this experiment to work in the manner you describe. In my experience, you don't want too much light, nor do you want too little ambient light. Maybe you can improve upon this experiment. Wouldn't it be cool if we could figure out a way to measure the spectrum- of sorts - of a sample using this simple method?
I think Deanna Cullen will be presenting on this at BCCE this summer, at least that's the plan for now. I've got something else in the works...
Experiment
Tom, I regret that I am not teaching anymore. I retired last year. However I follow interesting projects as yours. I passed the information to some teachers so they can benefit from it.
Regards
Pascual
In reply to Experiment by Pascual Lahuerta
Thanks for passing the information along!
Fantastic idea!
Hi Tom,
your idea is a very smart and live way to introduce concepts as transmittance and absorbance, and relationships with concentration.
I have found soon an app for Android: ColorMeter Free color picker that is similar to I-phone's.
Did you try to check stability of G% by changing diffuse lighting?
Alfredo
In reply to Fantastic idea! by ALFREDO TIFI
Thank you for your comments, Alfredo. This is a neat way to introduce transmittance, absorbance, Beer's Law, etc. Thank you for the information on the app for Android! We have not checked into how the lighting affects results. Basically, we find you don't want too much nor too little ambient light in the room.
alternative app?
Tom,
As always, another great idea. Thank you for sharing this!
So here is my problem. Since the time of your post (2016), Apple has pushed out iOS 11. I was searching for the app the other day that you demonstrated and it turns out that iOS 11 doesn't support this app (of course!). Are there any other apps that you are aware of, or any other cheap/abundant pieces of equipment that can measure R,G,B light in a similar manner?
New app for iOS 11
Thanks for pointing this out, Ben. I have run into this problem, too. Currently, the best solution (for no cost) I have found for the iPhone is Color Analyzer by Satoshi Nakamura, which does give live RGB values of a single chosen pixel in the camera view. Let me know how this works out for you, or if you find any apps that you think work better.
In reply to New app for iOS 11 by Tom Kuntzleman
thanks!
Will have to check it out, thanks!
App
Hi Tom
This is a fantastic idea! But I don't get data, which follows Beers law. I do, however get at very good linearity (r2 = 0,988), but the line doesn't go through (0,0). I guess it's because my app (ColorMeter) hasn't a "lock" button. Can I correct my measurements in any way? Or can you recommend another app (Color Analyser doesnt work for me either).
I use my lap top screen as a light source. It works fantastic.
Best wishes, Kim
In reply to App by Kim Bruun
Curious!
Hi Kim:
I've not run into this situation before...I'm very curious as to what could be causing this effect. Unfortunately, without seeing exactly how you are carrying out the experiments it will be difficult for me to answer your question. In terms of another app to try, consider using "Color Name" for iPhone. This app does not have a lock button, but I still tend to get good results with it. You can see me using this app in the video found here.
Let me know how things work.
In reply to Curious! by Tom Kuntzleman
Hi Tom
Thanks for a swift answer! I had this app (color name) recommended by a colleague too, but trouble is, that there is no longer a free version. You have to register with your bank account. You can have three days for free, but I don't want to ask students to register - some will forget to cancel their contract.
I use - inspired by your other video - a cardboard box with a slit in as the spectrophotometer. The pc screen behind and the smartphone in front of the slit. And an empty glass bottle as a cuvette. I could send you both my results and a photo of the set-up, but I have no idea how to do it from this page.
Best regards
Kim
Thanks - I have used your set up for another experiment.
Dear Tom,
Thank you for sharing your experiment. I used your set up for another experiment, where a Ph curve was created using bicarb as the base, vinegar as the acid and red cabbage indicator. In this experiment, we were measuring RGB values with a white background.
KInd Regards
Mariana
In reply to Thanks - I have used your set up for another experiment. by Mariana Berak
Acid/base titration
I'd love to see what you did with this. Do you have a write-up? How well did it work?
Thank you for this resource!
Hi Tom!
I tried this out and shared this at our virtual PD day event for our district. I was able to get good results without building a cardboard box-I set my computer brightness to 100% and collected data when it was still light outside. Another teacher quickly collected data in his kitchen during the session in a similar way and also got good results. Here's the presentation that includes a brief tutorial on the app and also sample data and photos: https://digitalcommons.imsa.edu/proflearningday/2021/session2/6/
Thank you for this! Teachers were appreciative of an alternative to using a spectrophotometer and also had ideas for how they might adapt for physics or middle school science :)
Karen
In reply to Thank you for this resource! by Karen Ye
Thank you for sharing your work with us
Hi Karen:
Thank you for reaching out. The PowerPoint presentation you made is fantastic. I will be sharing your slides with my students the next time we perform this activity in lab. Thank you so much for sharing this with us!
Tom
favorite post-lab problem (is based on my favorite TT video)
I wrote a question for use as part of a post-lab assignment. I particularly like it because meaningful questions covering spectrophotometer design are so difficult to write (mine are usually so trivial). I hope someone out there will get some more mileage out of it.
Q1. Watch the video Smartphone “Spectrophotometer” Smartphone Spectrophotometer
a. In the spectrometer, identify what is functioning as the source, the monochromator, sample holder, cuvette detector, and the display.
b. The accepted value for the extinction coefficient (ϵ) of Allura red (FD&C Red 40) 25,900 M-1cm-1 at 504 nm. Using this value of ϵ and his data what is the effective path length of the sample (the solo cup)? Show your work. How would you characterize the error in length: positive, negative, seriously positive, crazy negative?
Here is another good question, but I won't ask it this late in the semester. We're all getting tired.
c. Claim: The systematic error in the length of the solo cup resulted from the wavelength measured by the cellphone detector. Please provide the evidence and reasoning.
My answer, btw, is 2 cm for the cup length (diameter) which in my book is somewhere between a negative error and a crazy negative error.
In reply to favorite post-lab problem (is based on my favorite TT video) by Michael McCormick
Great questions!
Hi Michael:
Thank you so much for sharing these post lab questions. I will be having my students answer these questions in a few weeks when we do this lab. When you get the time, I sure would like to see your answer to part c.
In need of help
Hey, I'm doing a science fair project based on Absorption also. I found your video very educating and helped elevate my project with the use of equations. I used another colorimeter app that didn't give me an additional amount like yours did. To get A can I just add RBG up? Then continue with the formulas you gave?
In reply to In need of help by Juliana Noreus
Give your proposal a try
Hi Juliana, thank you for your question. I'm not entirely certain how to answer your question, without trying out the app that you used. Did your app report R, G, and B values separately? What color solutions were you using? I would suggest trying out what you propose above (adding together RGB values) for each standard and then plotting A values vs. concentration. If you get a straight line plot when doing this, then your proposal should work.
Searching ColorMeter App /w Region of Interest, Floating point
Hello!
How could we get floating point by avereraging over some rectangular pixel area one can define?
Is there some app able to do this or able to do math on pictures like wolfram alpha?
I would like to do a mobile phone spectrometer by 1 or 2 disperging reflections from DVD.
Bought 100m PMMA fibre for LED lighting stuff (useable down to 300nm). Very useful, as I want to take a bundle like 10 fibres and place them on a LED, then put them side to side and warm them and squeeze them from Fiber diameter to near flat in a wedge like fashion, to get a “line”, replacing the slit in most mobile phone DVD spectrometer settings, where they use two razor blades..
I’m just missing the ability to program an app.
Perhaps some html5 website demanding access to camera could do this, perhaps even locally.
Another idea is to just use a white dash from display (or blinking in the 3 Colors) that wanders over the display and imitates the motion of the slit in a spectroscope setup. This “slit” then gets dissected into the rainbow Color’s by 1 or 2 DVD pieces’ reflections and hits the Center of the (front camera) sensor.
I think most mobiles even have true Color sensors measuring more than 3 Color’s and having better resolution and wide dynamic range for doing the correct lighting exposure control of the camera. How to read them out?)
But as we have 2D cameras, we could just take a picture of the whole spectrum after it went through the fluid. Real PMMA phioles would be nice for this.
I am still searching for UV capable (up to 300nm that is) PMMA gratings, so one could dissect the light of some mixed UV/White LED.
Perhaps some front cameras have filters letting through some UV. I know they do for a bit nIR.
Thank you for your precise video!
Andi
Share Your Thoughts