The electron probability density isosurface defines the shape of the molecule and follows the relative outline defined by the atoms themselves. The electron probability density isosurface is usually drawn so that there is a particular probability, often 90%, that the electrons will be within the region of space enclosed by the surface.
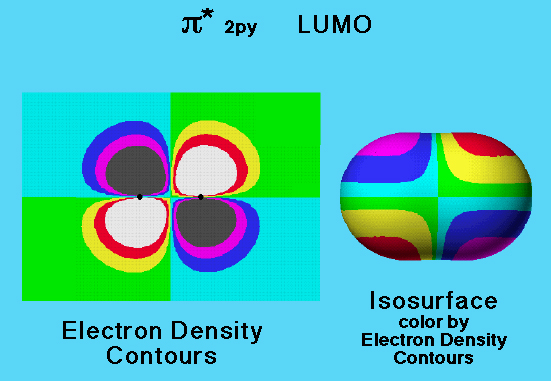
The underlying electron probability density contours of molecular orbitals can be visualized by coloring the electron density volume isosurface.
Contours in xy Plane
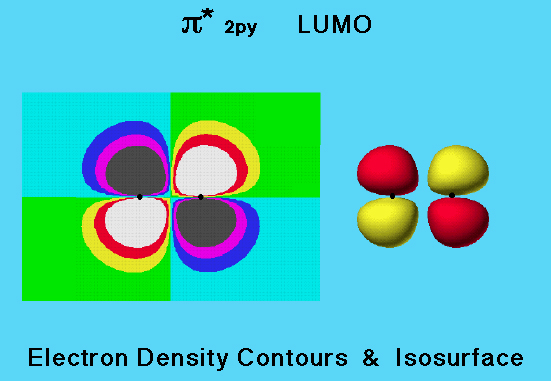
The electron probability density of the π* 2py (pi antibonding) molecular orbital may be represented with a two-dimensional isocontour map. The isocontour lines (lines along which electron density is constant) are between the colored regions in the diagram.

Plane Contour / Isosurface
This graphic compares electron density isocontours in the xy plane with the three-dimensional isosurface for the π* 2py (pi antibonding) molecular orbital of the nitrogen molecule.
The isocontour lines (lines along which electron density is constant) are between the colored regions in the diagram.

LUMO Density & Plane
In this graphic, the two dimensional electron probability density isocontours of the nitrogen molecule LUMO (shown on the left) have been mapped onto an isosurface for the electron density of the molecule (shown on the middle right). This model shows the location of the LUMO lobes within the space occupied by the molecule. The position of each of the four lobes, and that there are two lobes of each sign, can be easily seen from the colors on the surface. This representation is valuable because it locates on a surface that encloses a large percentage of the molecule's electron density, the areas where additional electrons could be accommodated. Such areas are available to share electrons from another molecule.
