The molecular electrostatic potential is the potential energy of a proton at a particular location near a molecule. Negative electrostatic potential corresponds to attraction of the proton by concentrated electron density in the molecule (from lone pairs, pi-bonds, etc.) Positive electrostatic potential corresponds to repulsion of the proton by the atomic nuclei in regions where relatively low electron density exists and the nuclear charge is incompletely shielded.
Electronegativity
Electronegativity of atoms in molecules indicates where partial charges are likely to be found—the most electronegative atom is most negative, the others are less negative or more positive.
A positive proton interacts with negative partial charge of oxygen in hypochlorous acid to produce an attractive force and a negative electrostatic potential. A positive proton interacts with the partial positive charge of hydrogen and chlorine to produce a repulsive force.

Partial Charge
The calculated partial charges represented as spheres (yellow is negative, red is positive) show how the molecule would interact with an approaching proton.

Compare with Electrostatic Potential
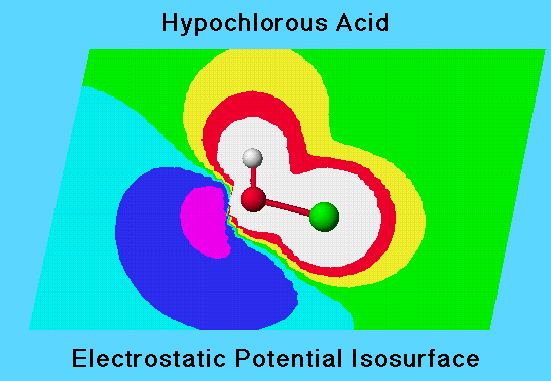
This graphic shows both partial charge and contours of electrostatic potential. When a unit positive charge (proton) approaches a positive region of the molecule, the repulsive interaction results in an increasing positive potential energy (colored yellow, red, and white on the contour diagram). As a proton approaches a negative region, an attractive interaction results in negative potential energy (colored aqua, blue, and violet on the contour diagram).

Electrostatic Potential Plane
In the diagram the elctrostatic potential for HOCL is represented by isosurface contours. Each colored section of the diagram represents a different range of electrostatic potential in the plane defined by the atomic nuclei. Electrostatic potential (contour value) approaches zero with distance from the nuclei.
A negative potential energy (areas colored aqua, blue, violet) appears in a region of high electron density (lone pairs) corresponding to a negative partial charge.

Plane / Isosurface
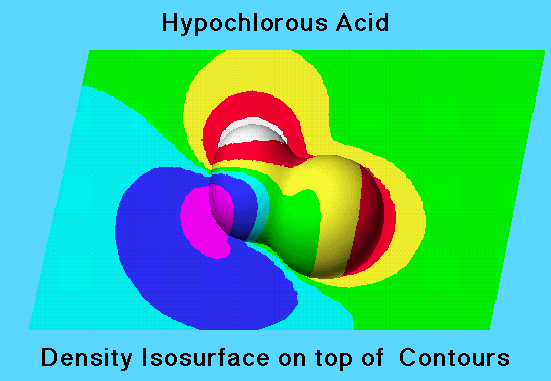
The electron density isosurface is a surface on which the molecule’s electron density has a particular value and that encloses a specified fraction of the molecule’s electron probability density. The electrostatic potential at different points on the electron density isosurface is shown by coloring the isosurface. In the graphic, the colored isosurface is shown superimposed on the electrostatic potential contour map in the plane of the atoms.

Electostatic Potential Isosurface
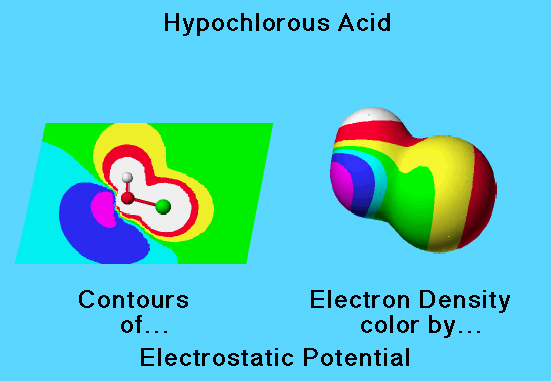
The electrostatic potential values are shown on the electron density volume isosurface using the spectral ordering of colors to represent electrostatic potential values:
White (most positive, proton most strongly repelled) > red > yellow > green > cyan > blue > violet > charcoal (most negative, proton most strongly attracted).
Regions low electron density are colored white or red to indicate positive electrostatic potential; regions of high electron density are colored blue or violet to indicate negative electrostatic potential.
