The distribution of electrons in a molecule determines its geometry, physical properties, and chemical properties. The wave-like distribution of electrons in atoms is described by the Schroedinger equation.
Unfortunately, even with this complex mathematical equation it is not possible to calculate the position of electrons within an atom or molecule. The best that can be done is to determine the electron probability density. This defines the probability of finding an electron within any given small volume of space. The region of space that holds about 90% of the electron density probability of a molecule is sometimes referred to as its electron density cloud, and is the best representation of the shape of the molecule.
Electron Density Isocontours
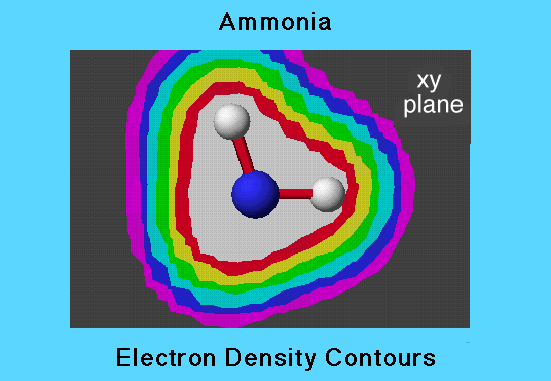
This example of ammonia shows a cross-section, or 2-dimensional view of the contours of electon probability density at various distances from the nuclei. The greatest electron probability density is within the white region closes to the nuclei. The greatest electron probability density is within the white region closest to the nuclei. The term "isocontour" refers to a surface (shown here in cross section) on which all points have the same electron probability density. Contour cross sections are shown here as the intersections between the different colored regions. Each succeeding contour away from the nuclei has one-half the probability density of the preceeding one.
The first contour (the outer edge of the whitre region) has a probability density value of 0.43 electrons per cubic angstrom, while the outer most contour has a probability of only 0.0067 electrons per cubic angstrom. this illustrates that there ismuch greater probability of finding an electron within a given small volume close to the nuclei than there is further away.

3-D Isocontour Planes
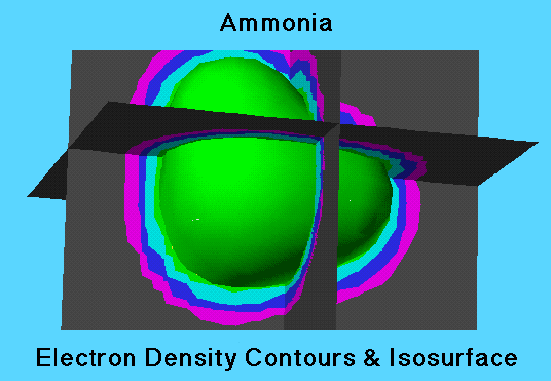
Since the electron density is a function of x, y, and z variables, it is natural to visualize the electron density probability in three dimensions. The electron density probability cloud is displayed as an isosurface superimposed on the 3-Dimensional isocontour planes. A isosurface is produced by showing all points that have the same value of the electron density probability function.

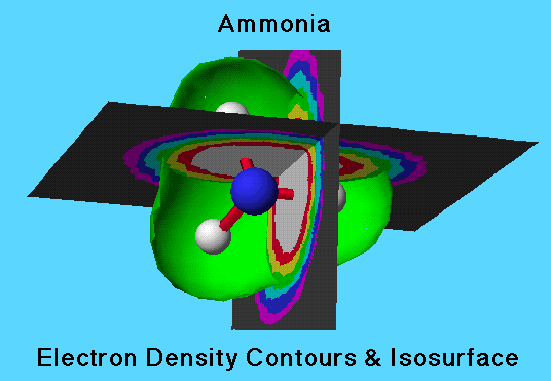
Issosurface cut-away
This shows the same three dimensional isocontour planes and the isosurface with the front cut away to display the posision of the nuclei (ball and stick model) inside.

Isosurface Density
The electron probability density isosurface is usually displayed without the underlying contours. It defines the shape of the molecule and follows the relative outline defined by the atoms themselves. The electron probability density isosurface is usally drawn so that there is a particular probability, often 90%, that the electrons will be within the regions of space enclosed by the surface.
